Before you can even think about boosting conversions, you need to play detective. What’s really happening on your site? This isn't about glancing at a few high-level numbers; it's about digging deep to find the exact spots where potential customers are giving up and leaving.
The idea is to get a complete picture by blending the quantitative data (what is happening) with the qualitative insights (why it’s happening). This two-pronged approach gives you a solid, evidence-based foundation for every single optimisation you make.
Diagnosing Your Current Conversion Performance

Jumping into conversion rate optimisation (CRO) without a proper diagnosis is like trying to fix a car engine with a blindfold on. You can tinker all you want, but you’re just guessing. A data-first approach ensures your efforts are sharp, targeted, and actually make a difference from day one.
First things first, you need a baseline. You can't improve what you don't measure. This means getting your analytics tools properly set up to track the entire user journey, from the moment someone lands on your homepage to when they see that "Thank you for your order" message.
Uncovering the 'What' with Quantitative Data
Your investigation starts with the hard numbers—the quantitative data that tells you precisely what users are doing on your site. For most businesses, the go-to tool for this is Google Analytics. It’s a goldmine of information, though if you're looking for something different, there are plenty of capable Google Analytics alternatives out there.
The real magic happens when you analyse your conversion funnel. This is the classic path a customer takes: homepage -> category page -> product page -> basket -> checkout. By mapping this out, you can instantly see where the biggest leaks are. Are people bailing on your product pages? Or is there a massive drop-off at the first step of the checkout?
Get familiar with these core metrics:
- Conversion Rate: The big one. What percentage of your visitors end up buying something?
- Funnel Drop-Off Rate: The percentage of people who leave at each specific stage of the buying journey.
- Basket Abandonment Rate: How many users add items to their basket but never finish the purchase?
- Average Order Value (AOV): The average amount, in pounds sterling (£), that a customer spends in a single transaction.
A critical part of this is knowing where you stand in the grand scheme of things. Context is everything. The average UK eCommerce conversion rate hovers around 3.4%, but it’s not a one-size-fits-all number. Grocery stores can hit a massive 11.1%, while sports and recreation sites might see something closer to 1.18% – 1.62%. Knowing your industry benchmark helps you set realistic goals.
To help you see how you stack up, here's a look at some typical conversion rates across different sectors in the UK.
UK eCommerce Conversion Rate Benchmarks by Industry
This table provides a summary of average UK conversion rates across various sectors to help you benchmark your performance.
| Industry Sector | Average Conversion Rate |
|---|---|
| Arts & Crafts | 4.01% |
| Electrical & Commercial Equipment | 3.97% |
| Pet Care | 3.28% |
| Fashion Clothing & Accessories | 2.44% |
| Food & Drink | 4.30% |
| Health & Wellbeing | 3.51% |
| Home Accessories & Giftware | 1.46% |
| Kitchen & Home Appliances | 2.68% |
| Sports & Recreation | 1.62% |
These figures give you a starting point, but remember that your own performance is what matters most. Use them as a guide, not a strict rule.
Finding the 'Why' with Qualitative Insights
Once you know what is happening, the next obvious question is… why? This is where you need to go beyond the numbers and get inside your customers' heads. Qualitative tools give you a window into the user experience that raw data just can’t provide.
Heatmaps, for instance, are brilliant. They create a visual representation of where people are clicking, how they're moving their mouse, and how far they're scrolling down a page. You might suddenly realise that a critical "Add to Basket" button is being completely ignored because it’s below the fold and nobody ever sees it.
Session recordings take things a step further. These tools let you watch anonymised recordings of real people using your site. It can be a humbling experience, but it’s invaluable for spotting frustrating bugs, confusing navigation, or moments of hesitation that you’d never have found otherwise.
Prioritising Optimisation for the Biggest Wins

Once you've diagnosed your website's performance, you’ll probably have a long list of potential fixes. That's a great start, but it can also be completely overwhelming. Where do you possibly begin? For a small or medium-sized business with limited time and resources, that's the critical question.
The key is to sidestep the temptation to get bogged down by minor tweaks that yield little return. Instead of just picking tasks at random, a structured approach will make sure you focus on changes that genuinely move the needle. A simple yet powerful framework can bring clarity to the chaos and help you make smart, strategic decisions.
Introducing the ICE Scoring Framework
One of the most effective methods I’ve come across for prioritisation is the ICE scoring model. It’s brilliant because it forces you to evaluate each potential optimisation idea against three simple criteria:
- Impact: How much of a positive effect will this change have on your conversion rate if it's successful?
- Confidence: How sure are you that this change will actually work and deliver the impact you expect?
- Ease: How simple is it to implement? Think in terms of time, technical skill, and cost.
By scoring each of these factors on a scale of 1 to 10 and then averaging the results, you get a clear, data-informed priority score. This simple calculation pushes the highest-value, lowest-effort changes right to the top of your to-do list.
Putting ICE Scoring into Practice
Let's make this real. Imagine your diagnostic phase uncovered two major issues: your overall site speed is painfully slow, and the call-to-action (CTA) button on your product pages is vague.
Here’s how the ICE model helps you decide where to focus first.
Task A: Complete Site Speed Overhaul
- Impact (9/10): A faster site dramatically improves user experience and is a known factor in boosting conversions. The potential impact is huge.
- Confidence (7/10): While speed improvements generally work, you're not 100% certain it's the biggest bottleneck for your specific audience.
- Ease (2/10): This is a major project, requiring significant developer time and potentially costing thousands of pounds. It's tough.
- ICE Score: (9 + 7 + 2) / 3 = 6.0
Task B: Change Product Page CTA Text
- Impact (6/10): A clearer, more compelling CTA can definitely increase add-to-baskets. It's a solid improvement, but maybe not a game-changer.
- Confidence (9/10): You have strong evidence from your heatmaps that users are hesitating here. You're very confident a simple text change will help.
- Ease (10/10): This is a five-minute job you can probably do yourself through your eCommerce platform's back end. It's extremely easy.
- ICE Score: (6 + 9 + 10) / 3 = 8.3
In this scenario, changing the button text wins, hands-down. It becomes your immediate priority, while the larger site speed project goes onto the backlog for future consideration. This is exactly how you build momentum and secure those crucial quick wins.
The goal isn't just to be busy; it's to be effective. Prioritisation frameworks like ICE ensure that every hour you invest in optimisation is spent on the tasks most likely to increase your ecommerce conversion rate and generate real revenue.
Broadening Your Strategic Approach
Once you've identified and prioritised your key areas for improvement, it's wise to explore broader strategies for conversion growth to ensure your efforts align with long-term business goals. This wider perspective helps you see how smaller fixes contribute to the bigger picture.
It's also essential to keep an eye on your competitors. Understanding their tactics can provide valuable context and new ideas for your own optimisation efforts. For deeper insights, it's helpful to learn how to conduct competitor analysis effectively as part of your ongoing strategy. This prevents you from optimising in a vacuum and helps you maintain a competitive edge in the market.
Running Experiments That Actually Teach You Something

You’ve done the diagnostic work, you know where your website is leaking conversions, and you’ve got a prioritised list of fixes. Now for the exciting bit: moving from planning to action.
Guesswork is the enemy of effective CRO. Real, sustainable growth comes from methodically testing your ideas. This is where so many businesses stumble, either by not testing at all or by running directionless experiments that don't teach them a thing.
A/B testing can sound intimidating, but it doesn't require a huge team or a massive budget to get started. The concept is simple: you show one version of a page to half your visitors (the 'control') and a tweaked version to the other half (the 'variation'). Then, you see which one performs better against your goal. Easy.
Building a Strong Hypothesis
Every worthwhile experiment starts with a strong hypothesis. This isn’t a vague idea like, “Let’s test button colours.” A proper hypothesis is a clear, testable statement explaining what you’re changing, why you think it will work, and what outcome you’re aiming for.
A solid hypothesis usually follows a simple formula:
"By [making this specific change], we believe [this group of users] will [perform a desired action] because [of this reason], which will [impact this key metric]."
Let's put it into practice. Instead of a flimsy "Test a new button colour," a robust hypothesis looks like this:
"By changing the 'Add to Basket' button colour from grey to a high-contrast green, we believe mobile users will click it more often because green is psychologically associated with 'go' and will stand out more on smaller screens. We predict this will increase add-to-cart clicks by at least 5%."
See the difference? This structure forces you to think through the user psychology behind the change and defines exactly what success looks like. Critically, even if the test 'fails' (meaning the variation doesn’t win), you still learn something valuable about your audience. That's a win in itself.
Real-World Test Ideas You Can Run Now
You don't need to reinvent the wheel for your first few tests. The smartest approach is to focus on your high-traffic, high-impact pages, like your product pages and checkout flow.
Here are a few practical A/B test ideas perfect for SMEs:
- Product Page Headline: Pit a benefit-led headline ("Sleep Deeper Tonight") against a feature-led one ("100% Mulberry Silk Pillowcase").
- Call-to-Action Text: Experiment with different button copy. Does "Buy Now" outperform "Add to Basket"? What about something more urgent like "Secure Your Order"?
- Trust Badges in Checkout: Test the placement or inclusion of different trust signals like secure payment logos (Visa, Mastercard) or money-back guarantee seals. Does adding them increase completions, or does it just add clutter?
- Shipping Information Clarity: Try making your shipping costs and delivery times more prominent on the product page versus hiding them until checkout.
- Simplifying Forms: Remove one non-essential form field from your checkout (e.g., 'Company Name') and measure the impact on your completion rate.
Each of these ideas is simple enough to implement but could significantly increase your ecommerce conversion rate. The goal is always to learn from every single experiment, win or lose, so you can build a repeatable process for continuous improvement.
Understanding Industry Nuances
Setting realistic goals for your experiments is vital. What works in one sector might flop in another. For example, UK-specific data from IRP Commerce reveals some critical insights.
While the fashion and accessories sector saw conversion rates climb by over 21% recently, beauty and wellness categories can achieve rates as high as 6.8%, far above the national average. Knowing where your business fits in helps you set smarter goals and prioritise the tests that are most likely to move the needle.
Ultimately, experimentation isn't just about finding one-off 'winners'. It's about building a deeper, more nuanced understanding of your customers. Each test, successful or not, gives you another piece of the puzzle, helping you make smarter, more customer-centric decisions across your entire business. That cumulative knowledge is what truly drives long-term conversion growth.
Tackling High-Impact Quick Wins
While big, structured A/B tests are the bedrock of long-term CRO success, some of your best gains come from fixing the obvious stuff right now. These are the high-impact quick wins—the low-hanging fruit that builds trust, cuts out friction, and gives you an immediate lift while your bigger experiments are still collecting data.
This approach means focusing on the two most critical battlegrounds of any e-commerce site: your product pages and your checkout funnel. Get these two areas right, and you can drastically increase your ecommerce conversion rate by calming user anxieties and making the path to purchase ridiculously smooth.
Optimising Your Product Pages
Your product page has one job: convince someone your product is the answer they’ve been looking for. It’s where window shoppers become buyers. Too many businesses fall into the trap of just listing features, but here’s the thing—customers buy benefits.
Instead of saying "100% waterproof material," frame the benefit: "Stay completely dry and comfortable, no matter how bad the weather gets." It’s a small shift, but it reframes your product as a problem-solver, not just an item.
To make your product pages genuinely compelling, zero in on these elements:
- High-Quality Imagery: People can't touch or feel your product online, so your photos have to do all the heavy lifting. Show multiple high-res shots from different angles, include lifestyle photos of the product in use, and think about adding a short video.
- Benefit-Focused Copy: Go through your product descriptions and rewrite them to focus on what the customer actually gains. Sell the outcome, not the specs.
- Visible Social Proof: Customer reviews are absolute gold. Make them prominent. Studies consistently show that reviews can significantly boost conversions because they offer authentic, third-party validation that builds instant trust.
Key Takeaway: Think of your product page as your best digital salesperson, not a catalogue entry. It needs to answer questions, build desire, and handle objections before the customer even thinks of them.
Getting your product pages right has a nice side effect, too. By making them more engaging and helpful, you improve the user experience, which often means people stick around longer. For more on this, you can explore some great strategies on how to reduce bounce rate and keep potential buyers on your site.
Streamlining Your Checkout Process
The checkout is the final hurdle. A customer has decided they want to buy, but this is precisely where an astonishing number of sales die due to needless friction. Cart abandonment rates often hover above 70%, and a clunky, confusing checkout is usually the main suspect.
Your goal here is ruthless simplification. Every single field, every extra click, every unnecessary step is another chance for a customer to give up and leave.
Put yourself in your customer's shoes and go through your own checkout. Is it simple? Is it transparent? Does it feel trustworthy?
Here are some of the most effective quick wins to implement:
- Offer a Guest Checkout: Forcing people to create an account is a legendary conversion killer. Always, always give them the option to check out as a guest. You can always prompt them to create an account on the "thank you" page after the money is in the bank.
- Remove Unnecessary Form Fields: Do you really need their phone number? Or their company name? Every field you can axe makes the process faster and less of a chore. Expedia famously boosted its annual profits by £12 million just by removing one single field from a form.
- Display All Costs Upfront: Surprise shipping costs are the number one reason people abandon their carts. Be totally transparent about all costs, including shipping and taxes, as early as you can—ideally right on the product page.
For more actionable tactics you can put in place today, dive into these conversion rate optimization best practices. Sorting out these common problems on your product and checkout pages will give you a powerful foundation for sustainable growth.
Your Practical 90-Day CRO Action Plan
An idea is only as good as its execution. It’s one thing to have a pile of data and insights, but turning it into real action is where most businesses stumble. A structured plan is your best friend here—it kills the guesswork and helps you build momentum.
This isn't about trying to boil the ocean or overhaul your entire business overnight. It's about making smart, steady progress. Think of this 90-day roadmap as your guide to creating a sustainable rhythm of optimisation, one that delivers tangible results without burning out your team.
Days 1-30: Diagnostics And Quick Wins
The first month is all about getting your house in order. Your main goal is to shift from making assumptions to making data-backed decisions. This means understanding exactly how your site is performing right now and fixing the most obvious problems costing you sales.
Here’s what you should focus on first:
- Analytics Health Check: Is your analytics platform actually working properly? Double-check that key conversion goals—like 'add to basket' clicks and successful checkouts—are being tracked accurately. You can't fix what you can't measure.
- Funnel Analysis: Find the leaks. Dive into your data and pinpoint the exact pages where you’re losing the most customers. Is it a specific product category page? The first step of the checkout? This is your treasure map.
- Qualitative Review: Time to understand the why. Install a heatmap or session recording tool and watch how real people interact with your site. You’ll be amazed at what you discover by seeing your website through your customers' eyes.
- Implement Quick Wins: Tackle the low-hanging fruit. This is where you can make an immediate impact. Think about adding a guest checkout, removing unnecessary form fields, and displaying shipping costs upfront. No surprises.
The timeline below shows some of the most impactful areas to hit first.
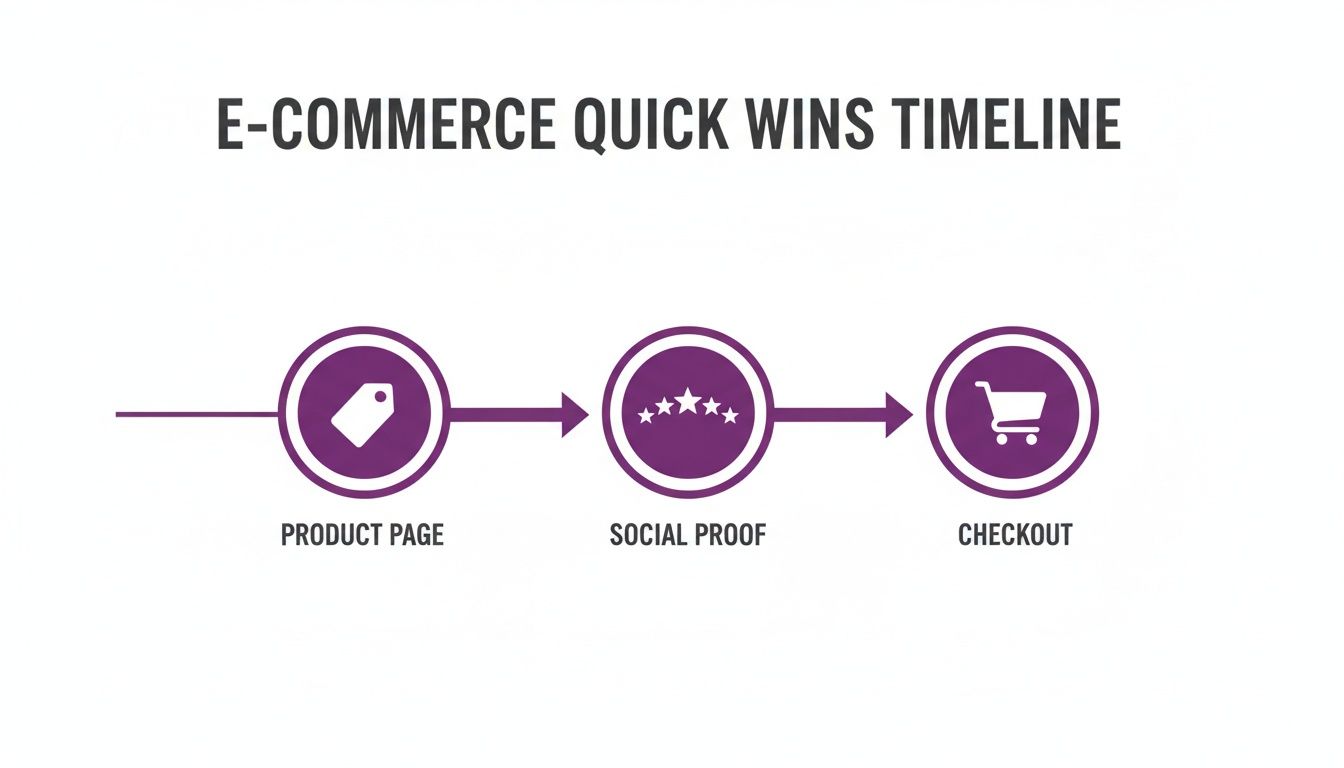
Starting with product page clarity, then building trust with social proof, and finally smoothing out the checkout is a logical, powerful sequence.
Days 31-60: Prioritisation And Testing
With a month of solid data under your belt and the most glaring issues fixed, you can get more strategic. This phase is all about using your insights to form a strong hypothesis and launch your first proper A/B test.
The goal here isn’t just to find a ‘winner’. It’s about building a testing muscle. A test that fails to beat the original is still a win—it teaches you something crucial about your customers and prevents you from making a bad change.
In this phase, you’ll want to:
- Prioritise Your Findings: You can’t fix everything at once. Use a simple framework like ICE (Impact, Confidence, Ease) to score the problems you've identified. This will help you decide which one offers the biggest opportunity right now.
- Formulate a Strong Hypothesis: Based on your top-priority issue, write a clear, testable hypothesis. For example: "By changing our generic 'Submit' button to 'Get Your Free Quote', we believe more users will complete the form because the language is specific and highlights value."
- Design and Launch Your Test: Create your variation and get your A/B test live. Just make sure you have enough traffic to reach statistical significance in a reasonable amount of time.
Days 61-90: Analysis And Scaling
The final month is where you turn this one-off project into a continuous growth engine. It’s about interpreting your results and embedding optimisation into your day-to-day operations. If you're hungry for more long-term ideas, explore our guide on ecommerce growth strategies.
Your tasks for this period include:
- Analyse Test Results: Once the test is done, dig into the data. Did the variation win? If so, by how much? And don’t stop there—segment the results. Did it perform better for mobile users or new visitors? The details matter.
- Implement Winners and Learn from Losers: If you have a clear winner, roll it out across the site. If the test was a dud, document what you learned and use those insights to inform your next hypothesis.
- Plan Your Next Experiment: The cycle begins again. Take your learnings, grab the next idea from your prioritised list, and start planning your second test.
To help you visualise this, here’s what a practical 90-day plan could look like for a small to medium-sized business.
Example 90-Day CRO Activity Plan for an SME
This table breaks down the 90-day plan into a clear, actionable structure, giving you a template to adapt for your own business.
| Phase | Key Focus | Example Tasks |
|---|---|---|
| Days 1-30 | Foundation & Quick Wins | • Set up and verify Google Analytics goals. • Install a heatmap tool like Hotjar. • Identify top 3 exit pages in the funnel. • Add a guest checkout option. |
| Days 31-60 | Prioritisation & First Test | • Create a backlog of test ideas from your research. • Score ideas using an ICE framework. • Formulate a hypothesis for your top-priority idea. • Design and launch your first A/B test. |
| Days 61-90 | Analysis & Iteration | • Analyse the results of your first test. • Implement the winning variation (if applicable). • Document learnings and share with the team. • Begin planning your next experiment. |
This structure turns the complex challenge of CRO into a series of achievable steps. It’s not about perfection; it’s about consistent, intelligent effort.
Common Questions About CRO
Diving into conversion rate optimisation always sparks a few questions. Let's tackle some of the most common ones we hear from UK business owners, so you can get started with clarity.
What Is a Good eCommerce Conversion Rate in the UK?
Everyone wants to know "what's a good number?" While the UK average hovers around 3.4%, the real answer is… it depends entirely on your industry.
A niche food and drink brand might easily clear 4%, while a store selling high-end sports equipment could be doing great at 1.6%. It’s all relative.
For most small to medium-sized businesses, aiming for a consistent 2.5% to 3% is a solid starting goal. If you're already past the 3% mark, you're in a strong position. The best approach? Stop worrying so much about industry averages and focus relentlessly on beating your own baseline, month after month. That's where the real growth happens.
How Long Does It Take to See Results from CRO Activities?
The timeline really varies. You can see the impact of some changes almost immediately.
Quick wins, like clarifying shipping costs or ditching unnecessary fields in your checkout form, can give you a noticeable lift in just a few weeks. You’re removing obvious roadblocks, so the results are often fast.
Proper A/B testing, on the other hand, is a game of patience. To get a statistically sound result, you’ll need to let a test run for several weeks, especially if your traffic is on the lower side. Think of CRO as a long-term game. You should feel the buzz of early wins from low-hanging fruit in the first 30-60 days, but the more substantial, sustainable growth will build over 3-6 months as you get into a rhythm of testing and learning.
Should I Focus on Desktop or Mobile Optimisation First?
Your own analytics data holds the answer here. Dig into your reports and look for the biggest disconnect.
For most UK ecommerce stores, the story is the same: mobile drives the lion's share of traffic, but desktop still brings home most of the sales.
That gap—high mobile traffic but low mobile conversions—is a massive clue. It screams that people are happy to browse on their phones but find the actual buying process too clunky. They either switch to their laptop to finish the purchase or, worse, they just give up. That's why, nine times out of ten, starting with mobile optimisation offers the biggest potential for quick gains.
Focus your first efforts on making your mobile checkout an absolute breeze, slashing page load times, and simplifying navigation for thumbs and small screens.
How Much Does Conversion Rate Optimisation Cost an SME?
The cost of CRO can scale to fit almost any budget, which is great news for businesses that need to watch the pennies.
You can get started with virtually zero financial outlay. Tools like Google Analytics for digging into data and Google Optimize for running simple A/B tests are completely free to use.
Once you’ve got some momentum, you might decide to invest in more specialised tools for things like heatmaps or session recordings, which can cost anywhere from £50 to a few hundred pounds a month. The critical thing is to see CRO as an investment, not a cost. A successful programme pays for itself by squeezing more revenue out of the traffic you already have, making it one of the most powerful and cost-effective ways to grow your business.
Ready to turn more of your visitors into customers? At Bare Digital, we specialise in data-driven SEO and conversion rate optimisation that delivers measurable results for businesses across the UK. Get your free, no-obligation SEO Health Check today and receive a tailored action plan to start boosting your conversions. Find out more at https://www.bare-digital.com.