A monthly SEO report template is your secret weapon for tracking and explaining how your search engine optimisation work is paying off. It takes all that raw data from tools like Google Analytics and Search Console and weaves it into a clear story, highlighting the stuff that actually matters—like organic traffic, keyword rankings, and, most importantly, conversions. Honestly, using a personalised template is the only way to properly show your value to stakeholders and make smart, data-driven decisions.
Why Generic SEO Reports Are Holding You Back
Let's be real for a moment. That one-size-fits-all report spat out by your SEO tool isn't telling the whole story. Before we even think about building your new template, we need to get clear on why a customised monthly SEO report is absolutely non-negotiable.
A generic export crammed with vanity metrics might look impressive at first glance, but it almost always fails to connect your hard work to what the business actually cares about.
A personalised approach, on the other hand, digs deeper than surface-level data. It's all about tying your optimisation efforts directly to tangible business outcomes—leads, sales, and revenue. It tells a story that makes sense to everyone in the organisation, not just the marketing team.
Moving Beyond Vanity Metrics
The biggest problem with most automated reports is their obsession with metrics like raw traffic or total impressions, completely stripped of context. Sure, a traffic spike looks great on a chart, but it means very little if those new visitors are bouncing immediately or not converting.
A truly effective report answers the "so what?" question. Instead of just dumping numbers on a page, it offers analysis. For example, you can connect a successful blog post not just to its traffic figures, but to the exact number of newsletter sign-ups it generated. You can link technical fixes, like the ones you'd find in a thorough technical SEO audit, to better user engagement and a lower bounce rate on your most critical service pages.
Speaking the Language of Business
Your CEO and your marketing manager care about different things. The C-suite wants to see the return on investment (ROI), growth in market share, and how SEO is contributing to the bottom line. A generic report rarely, if ever, communicates this effectively.
A bespoke report translates technical SEO wins into business language. It frames your efforts in terms of commercial success, proving the real value your optimisation strategy delivers. This customisation is what secures buy-in and justifies continued investment.
This need for smarter reporting is clearly reflected in the market's growth. The UK SEO software market pulled in significant revenue in 2024 and is projected to nearly double by 2030. This just goes to show how heavily UK businesses are relying on these tools to get a competitive edge. You can find more data on this market expansion from Grand View Research.
To really appreciate why this matters, it helps to first understand the fundamentals of what is SEO and its core principles. By tailoring your report, you ensure every piece of data is relevant, impactful, and clearly communicates the right information to the right people.
Gathering the Data That Actually Matters

A powerful report starts with the right ingredients. Before you even think about opening a spreadsheet or a Looker Studio project, you need to pull the right data. It’s a simple step, but getting it right ensures your monthly SEO report is packed with information that actually reflects performance.
This is about moving beyond basic traffic numbers to pinpoint the key performance indicators (KPIs) that really matter to a business. Think of it as assembling the pieces of a story. Without the right characters (your metrics) and plot points (the trends), you’re just left with a pile of disconnected facts.
Core Data Sources and What to Pull
Your most valuable data will come from a trinity of essential tools. Each one gives you a different piece of the performance puzzle, and when you put them together, you get the full picture.
-
Google Analytics 4 (GA4): This is your go-to for understanding user behaviour. You’ll want to pull data on organic sessions, user engagement, and most importantly, conversions. How many people filled out a contact form or made a purchase after landing on your site from a search engine? That's the gold right there.
-
Google Search Console (GSC): GSC tells you exactly how Google sees your site. Focus on extracting data for total clicks, impressions, and the average position for your main commercial and informational search terms. It’s the best place to spot visibility trends and uncover new opportunities.
-
SEO Platforms (e.g., Semrush, Ahrefs): These tools add competitive context and deeper insights. I use them to track keyword ranking movements over time, keep an eye on the backlink profile (new referring domains are great, lost links need investigating), and see what the competition is up to.
By pulling these specific data points, you build a solid foundation. You’re not just seeing how many people visited, but what they did, how they found you, and how you stack up against others in your space.
To make this crystal clear, here’s a breakdown of the core metrics you should absolutely have in your report.
Core Metrics for Your Monthly SEO Report
This table outlines the essential metrics to include, where to find them, and why they are so crucial for demonstrating your SEO performance.
| Metric Category | Specific KPIs to Track | Primary Data Source | Why It Matters |
|---|---|---|---|
| Website Performance | Organic Sessions, New vs. Returning Users, Engagement Rate | Google Analytics 4 | Shows the volume and quality of traffic driven by your SEO efforts. |
| Search Visibility | Total Clicks, Impressions, Average Click-Through Rate (CTR) | Google Search Console | Measures how often your site appears in search and how many people click through. |
| Keyword Rankings | Top 10 Keyword Positions, Ranking Distribution, Average Position | SEO Platform (e.g., Semrush) | Directly tracks your visibility for the specific terms that drive business. |
| Business Impact | Organic Conversions, Goal Completions, Conversion Rate | Google Analytics 4 | Connects SEO activities directly to tangible business outcomes like leads or sales. |
| Off-Page Authority | New Referring Domains, Lost Backlinks, Authority Score | SEO Platform (e.g., Ahrefs) | Indicates the strength and trustworthiness of your site in Google's eyes. |
Tracking these KPIs consistently month-on-month is what turns a simple data dump into a strategic tool that guides your next moves.
Organising Your Data for Clarity
Once you've got the data, a little organisation goes a long way. Don't just dump everything into a random folder—that’s a recipe for a headache later.
I find it easiest to create a simple structure, maybe in a Google Sheet, with separate tabs for each data source. One tab can hold your GA4 export, another your GSC query data, and a third for your keyword rankings. This methodical approach keeps things accurate and makes it much easier to cross-reference information when you start building the actual report.
The goal isn’t to collect every metric under the sun. It’s about being selective. Focus on the data that directly answers the question, "Are our SEO efforts actually helping the business grow?"
For anyone managing their own campaigns, knowing which metrics to prioritise is a game-changer. You can find more detail on this in our guide on how to do SEO yourself, which explains how these data points fit into a broader strategy. With this framework, you’re ready to populate your template with meaningful, accurate information.
Putting Your Report Together, Piece by Piece
Right, you’ve got all your data sorted. Now for the fun bit: actually building your monthly SEO report template. The trick is to create a narrative that flows logically, guiding anyone reading it from the big-picture summary right down to the nitty-gritty details that matter. A well-structured report tells a story, making what can be complex data easy to digest and act on.
Think of each section as a chapter. We'll kick things off with a high-level overview for the busy execs, then drill down into the performance metrics your marketing team will want to pore over.
This whole process is about making sure every bit of data has a purpose and adds to the story of your SEO performance. This infographic breaks down the simple, three-stage workflow you'll follow each month.
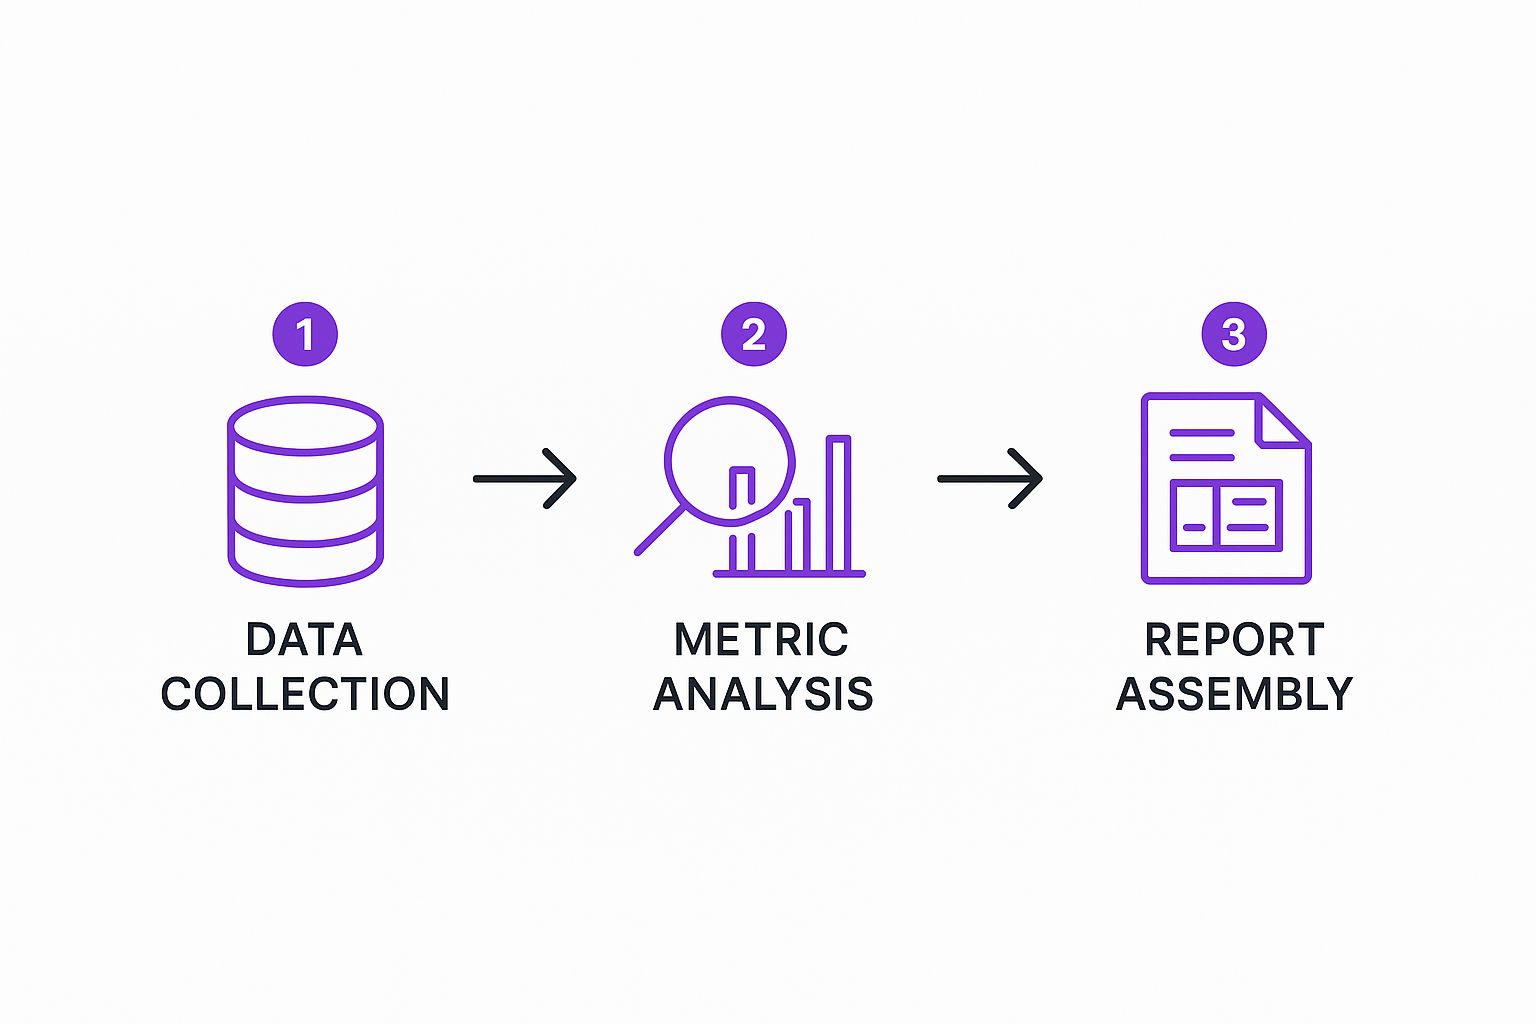
As you can see, it’s a straightforward path from gathering the raw data, to analysing the key metrics, and finally, to slotting it all into the report. Following this keeps things consistent and efficient.
The Executive Summary: An Absolute Must
Honestly, this is probably the most crucial part of the entire report. A lot of stakeholders, especially those in leadership, might only read this section. It needs to be short, sharp, and laser-focused on business outcomes.
Start with the headline results. Did organic traffic drive a 15% increase in qualified leads this month? Lead with that. This isn't the place for jargon; it's where you draw a straight line from your SEO work to revenue, leads, and ROI.
Your summary should briefly cover:
- Overall Performance: A single, punchy sentence summing up the month's results.
- Key Wins: Pinpoint one or two major successes, like hitting page one for a high-value keyword.
- Challenges & Learnings: Briefly touch on any dips and, more importantly, what you learnt from them.
- Next Steps: A clear, strategic recommendation for what's next on the agenda.
Organic Performance Deep Dive
This is where you lay out the core health metrics of your SEO campaign. It’s the engine room of your report, showing the direct impact of your optimisation efforts on website traffic and how users are engaging.
Visuals are your best mate here. Use simple line or bar charts from Looker Studio or even just a spreadsheet to show trends for:
- Organic Sessions: Compare this month to last month, but also to the same month last year. This gives crucial seasonal context.
- Conversions & Goals: Show the actual number of leads, sign-ups, or sales that came from organic traffic.
- Engagement Rate: A high engagement rate is a great sign that you’re pulling in the right crowd.
Always add a bit of commentary to your charts. Don't just show a graph of traffic going up; explain why it happened. For example, "The 20% uplift in organic sessions was driven by our new blog series, which now ranks for three important long-tail keywords."
Keyword Visibility and SERP Presence
Here’s where you show how your visibility in the search results is improving. This isn't about listing every single keyword that moved up or down. Instead, focus on what's genuinely meaningful.
Highlight rankings for high-intent, commercial keywords—the ones closely tied to your products or services. It helps to group them into themes for easier digestion, like 'Service Keywords' or 'Brand vs. Non-Brand'. Showing progress for a group of keywords that directly impacts sales is far more powerful than reporting on hundreds of insignificant terms.
Backlink Profile Health
Finally, dedicate a section to your off-page authority. Backlinks are still a massive ranking signal, and stakeholders need to see that your website’s authority is growing over time. Keep this section focused and high-level.
You’ll want to include metrics like:
- New Referring Domains: Showcasing the number of new websites linking to you is a great measure of momentum.
- High-Quality Link Examples: Call out one or two really impressive links you've acquired from authoritative sites.
- Authority Score Trend: A simple chart showing the month-on-month growth of your Domain Authority (or a similar metric) works wonders.
If link building is a core part of what you do, you can dig into more detailed tactics in this guide on how to build backlinks to support your efforts. This section of the report proves your site is earning trust and credibility in your industry—something that’s fundamental to long-term SEO success.
Turning Data into Actionable Insights

A template stuffed with data is just noise. This is where your expertise comes in—your ability to connect the dots and tell the story behind the numbers is what gives the report real strategic value. Raw metrics don't mean much until you give them context and turn them into a clear plan.
For instance, simply saying organic traffic went up by 10% is table stakes. The real insight is explaining why. Was it the technical fix that boosted site speed last week? Or did that new blog post finally start ranking for a few high-value keywords? Your commentary is what transforms a passive update into a strategic document.
Connecting the Dots Between Metrics
Great analysis is all about seeing how different metrics influence each other. You're looking for correlations to understand what’s causing the shifts you're seeing. This is the difference between just reporting on data and providing genuine insights that actually drive decisions.
Let's say you notice a drop in rankings for a key commercial term. A good analyst digs deeper. Did a competitor just launch a massive content hub targeting that exact phrase? Your commentary should flag this connection and propose a counter-move, like refreshing your existing content or building a few authoritative backlinks to reclaim the spot.
Or think about this scenario: you deployed a technical SEO fix, like implementing schema markup, two weeks ago. In your report, you should draw a direct line between that action and any improvements in click-through rates or rich snippet appearances. This shows a clear cause-and-effect relationship, proving the value of your technical work.
Writing Clear and Compelling Commentary
Your analysis needs to be written in plain, jargon-free English. The goal is for anyone, from the marketing manager to the CEO, to understand the story of your SEO performance without needing a translator.
To make your commentary really land, stick to these principles:
- Celebrate the Wins: Clearly state what went well and, crucially, tie the success back to specific actions you took. This constantly reinforces the value of your strategy.
- Explain the Dips: Don't shy away from poor performance. Address any drops in traffic or rankings head-on, offer a data-backed hypothesis for why it happened, and lay out a clear plan to fix it.
- Set Realistic Expectations: Use the data to forecast what's likely to happen next month. This helps manage stakeholder expectations and frames your upcoming work in a strategic light.
The most powerful part of your monthly SEO report isn't the data itself, but the narrative you build around it. Your commentary provides clarity, demonstrates expertise, and justifies your strategic direction for the following month.
To make sure your data is easy to digest, applying data visualization best practices can make a huge difference. Good visuals support your narrative and make complex information instantly understandable.
The importance of sharp analysis is clear when you look at the UK market. As of 2023, the UK SEO industry hit a value of £19.2 billion, growing at an impressive 11.2% annually over five years. With 42% of UK consumers using search engines to find products, effective performance tracking is absolutely essential to tap into this behaviour.
Tailoring Your Report for Different Audiences
A one-size-fits-all report rarely lands with any real impact. Let's be honest, your CEO and your content manager care about completely different things. To make your reporting effective, you have to customise it. Adapting your monthly SEO report for different internal teams is the key to making sure the information is relevant, easy to digest, and actually drives the right conversations.
The trick is to match the data you're showing to the priorities of the person reading it. For leadership, it’s all about the big picture—the business impact. For the marketing team, the focus needs to shift to the nitty-gritty tactical details and performance metrics that shape their day-to-day work. This targeted approach is how you ensure your report gets read and, more importantly, acted upon.
Crafting a High-Level Executive Summary
When you're reporting up to the C-suite or senior management, less is almost always more. They're focused on ROI, lead generation, and overall business growth. They need a quick, clear snapshot that connects your SEO performance directly to these top-line goals.
Your executive version of the report should cut straight to the chase:
- Key Business Outcomes: Lead with the numbers that really matter, like organic-driven revenue, new customer acquisition from search, or the total number of qualified leads you’ve generated.
- Market Share and Visibility: Don’t just show your own performance in a vacuum. Frame it against your key competitors. A simple chart showing your "share of voice" for critical commercial keywords can be incredibly powerful.
- Top-Level Trend Analysis: Give them a brief, jargon-free summary of your overall organic traffic and conversion trends. Crucially, focus on the "why" behind any major shifts, not just the "what."
This high-level view proves the commercial value of your work without getting bogged down in technical details they just don’t have time for.
Providing Granular Detail for the Marketing Team
While the executive summary is all about brevity, the version for your marketing colleagues needs to be the complete opposite. This is the report that fuels tactical decisions and helps refine the strategy moving forward. It’s where you put all the in-depth data you wisely left out of the leadership summary.
A detailed report for the marketing team should act like a diagnostic tool. It gives them the specific data points needed to celebrate what’s working, pinpoint what isn’t, and figure out the next steps to how to improve website traffic and performance.
This more comprehensive report should dig into areas like:
- Specific Keyword Movements: Go beyond just the big-hitter keywords. Track long-tail variations and movements within specific content clusters to see what’s really resonating.
- Content Performance Data: Break down which blog posts, landing pages, or service pages are pulling in the most organic traffic and, more importantly, conversions.
- Technical SEO Health: Provide updates on things like site speed, crawl errors, and indexation status. The key here is to connect these technical elements back to their impact on actual performance.
This level of customisation makes sure everyone gets the right information. And as SEO becomes more central to business, this kind of reporting is non-negotiable. With 60% of UK businesses now having an SEO strategy in place, the need to monitor and refine is more critical than ever. Other UK digital marketing statistics show that 56% use Local SEO and 50% lean on content marketing—all areas that demand detailed tracking to get right.
Still Have Questions About SEO Reporting?

Even with the slickest report template, questions are going to pop up. That’s a good thing. Getting ahead of them shows you know your stuff and helps turn your reporting into a collaborative chat instead of an interrogation.
One of the most common questions I get is about traffic dips. A client or manager sees organic sessions drop and, understandably, starts to worry. You absolutely need to have a data-backed explanation ready to go. More often than not, the culprit is something normal like seasonality, a competitor running a big campaign, or one of Google’s many algorithm updates.
Your job is to add context. Don’t just point out the dip and move on. Explain what’s likely causing it and, more importantly, what your plan is to tackle it. This instantly flips a negative talking point into a showcase of your strategic thinking.
How Often Should I Send an SEO Report?
While this guide has focused on a monthly report, the best frequency really depends on the project's pace and who you're reporting to.
- Monthly: This is the industry standard for a reason. It gives you enough data to spot real trends without drowning everyone in information. It’s perfect for showing consistent, steady progress.
- Quarterly: For more established, long-term projects, a deep-dive quarterly review is a great way to supplement shorter monthly check-ins. This format is ideal for high-level strategy chats with leadership.
- Weekly: Honestly, this is almost always too frequent. It encourages knee-jerk reactions to tiny fluctuations that don't mean much. I'd only recommend weekly updates for critical moments, like right after a major website migration or during a massive product launch.
The whole point of a report is to deliver actionable insights, not just a data dump. A monthly schedule usually hits that sweet spot, providing enough detail to make smart decisions without getting bogged down in daily noise. Pick the frequency that actually helps you plan your next move.
At the end of the day, a solid reporting process is all about clear and consistent communication.
Ready to transform your SEO reporting and see real growth? At Bare Digital, we create transparent, data-driven strategies that deliver results. Get your free SEO Health Check and a custom proposal within 24 hours. Start boosting your rankings and revenue today. Find out more at https://www.bare-digital.com.